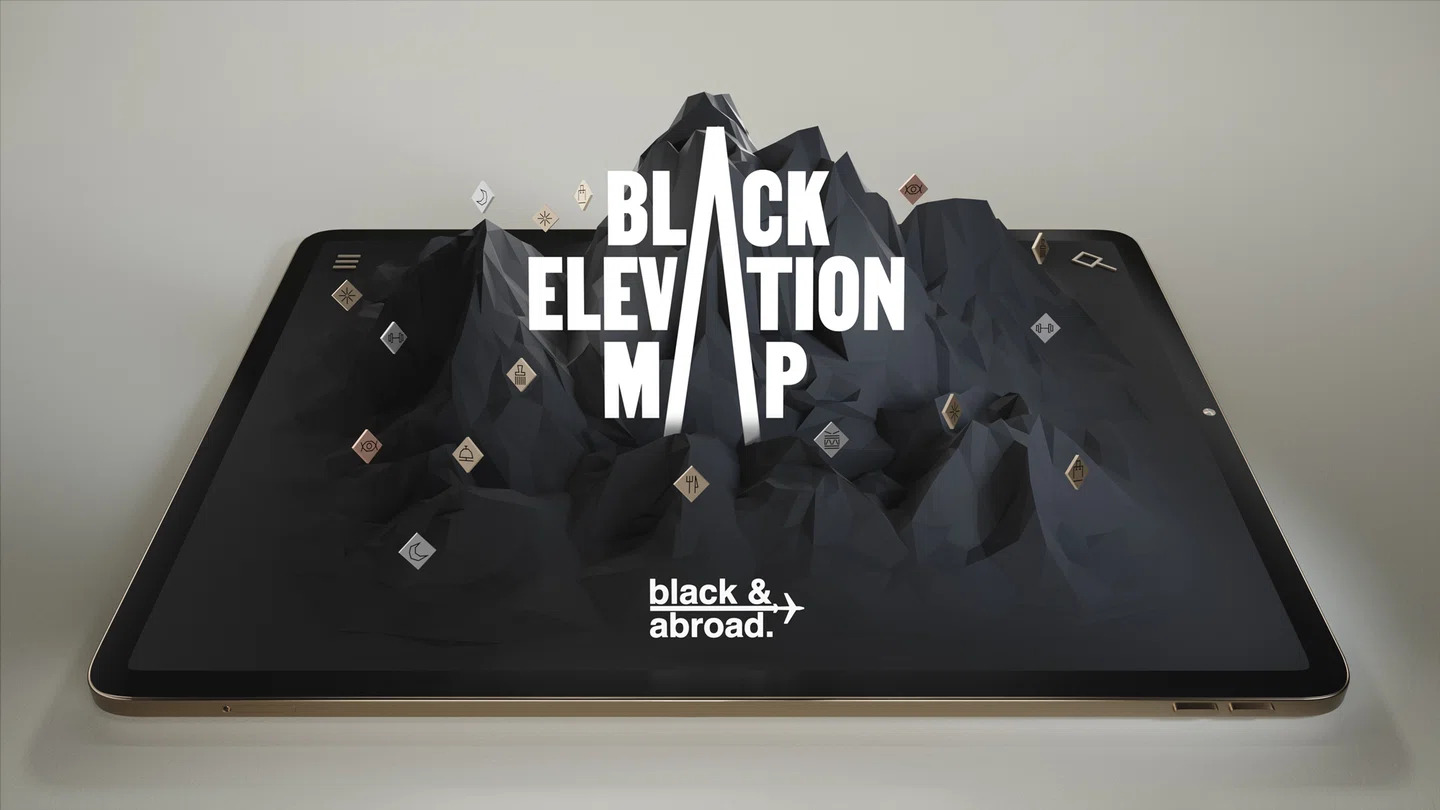
The Black Elevation Map | A data visualisation project that elevates Black cultural data

The Black Elevation Map is an immersive digital experience that reimagines the American landscape by visualizing the heights of The Culture as elevation. The platform takes cultural data, such as Black population data, historical markers, Black-owned businesses, and social media activity, and visualizes it as points of interest on a dynamic, searchable elevation map of the United States. The greater the density of data, the higher the elevation.
Why a map?
From redlining to modern urban planning, you don’t have to look far to see ways in which maps have been used to marginalize, divide and oppress communities around the world. Brand want this project to help Black travelers see the country in a way that prioritizes and celebrates the contributions of folks who look like us – and facilitates travel choices that deepen engagement within our community. Repurposing a traditional elevation map is a way for us to weave joy and depth into the story, the experience, and our interpretation of the data.
Where’s the data coming from?
At launch, the Black Elevation Map contains more than 30,000 unique points of interest, plus detailed population data, and Black-travel-related social media activity data. In choosing which data to include in this project, they wanted sources where the Black community had self-identified, versus data collection sources that try to identify without consent.
Source
Yelp and Google, both of which have options for business owners to self-identify as Black-owned. The map also includes data classified as “African American” from The Historical Markers Database.
How does the travel feed work?
The travel feed pulls in Black travel-related social media conversations from Twitter and Insta based on hashtag use. It’s categorized across three main streams, for a total of 1,500 social sources across 53 unique embedded data feeds.
Credits
Agency: Performance Art / Toronto
Client: Black & Abroad